Enumerating structures
Predicting mixing energies
In this step the cluster expansion constructed previously will be employed to predict the mixing
energies for a larger set of structures that are obtained by enumeration. After
loading the CE from file, we loop over all structures with up 12 atoms in the
unit cell and compile silver concentrations and predicted mixing energy into a
list, which is calculated by calling the predict method of the ClusterExpansion object with the ASE Atoms object
that represents the present structure as input argument.
ce = ClusterExpansion.read('mixing_energy.ce')
species = ['Ag', 'Pd']
data = {'concentration': [], 'mixing_energy': []}
structures = []
cluster_space = ce.get_cluster_space_copy()
chemical_symbols = cluster_space.chemical_symbols
primitive_structure = cluster_space.primitive_structure
for structure in enumerate_structures(structure=primitive_structure,
                                      sizes=range(1, 13),
                                      chemical_symbols=chemical_symbols):
    conc = structure.get_chemical_symbols().count('Pd') / len(structure)
    data['concentration'].append(conc)
    data['mixing_energy'].append(ce.predict(structure))
    structures.append(structure)
print('Predicted energies for {} structures'.format(len(structures)))
Extracting the convex hull
Using this set of mixing energies we then generate the convex hull using the
ConvexHull class.
hull = ConvexHull(data['concentration'], data['mixing_energy'])
Plotting the results
The predicted energies can be plotted together with the convex hull as a function of the concentration.
fig, ax = plt.subplots(figsize=(4, 3))
ax.set_xlabel(r'Pd concentration')
ax.set_ylabel(r'Mixing energy (meV/atom)')
ax.set_xlim([0, 1])
ax.set_ylim([-69, 15])
ax.scatter(data['concentration'], 1e3 * array(data['mixing_energy']),
           marker='x')
ax.plot(hull.concentrations, 1e3 * hull.energies, '-o', color='green')
plt.savefig('mixing_energy_predicted.png', bbox_inches='tight')
The figure thus generated is shown below.
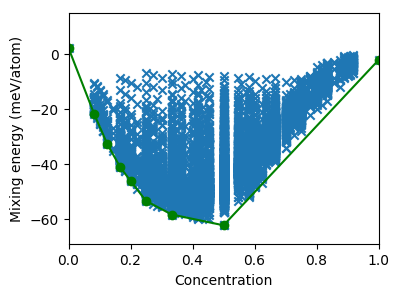
Predicted mixing energies versus concentration for a set of systematically enumerated structures.
Filtering for low energy structures
The ConvexHull class also provides some
convenience functions including e.g., the possibility to extract the indices of the
structures that are within a certain distance of the convex hull.
tol = 0.0005
low_energy_structures = hull.extract_low_energy_structures(
    data['concentration'], data['mixing_energy'], tol)
print('Found {} structures within {} meV/atom of the convex hull'.
      format(len(low_energy_structures), 1e3 * tol))
These structures can then be calculated for example using the reference method of choice.
Source code
The complete source code is available in
examples/tutorial/3_enumerate_structures.py
# This scripts runs in about 14 minutes on an i7-6700K CPU.

import matplotlib.pyplot as plt
from numpy import array
from icet import ClusterExpansion
from icet.tools import ConvexHull, enumerate_structures

# step 1: Predict energies for enumerated structures
ce = ClusterExpansion.read('mixing_energy.ce')
species = ['Ag', 'Pd']
data = {'concentration': [], 'mixing_energy': []}
structures = []
cluster_space = ce.get_cluster_space_copy()
chemical_symbols = cluster_space.chemical_symbols
primitive_structure = cluster_space.primitive_structure
for structure in enumerate_structures(structure=primitive_structure,
                                      sizes=range(1, 13),
                                      chemical_symbols=chemical_symbols):
    conc = structure.get_chemical_symbols().count('Pd') / len(structure)
    data['concentration'].append(conc)
    data['mixing_energy'].append(ce.predict(structure))
    structures.append(structure)
print('Predicted energies for {} structures'.format(len(structures)))

# step 2: Construct convex hull
hull = ConvexHull(data['concentration'], data['mixing_energy'])

# step 3: Plot the results
fig, ax = plt.subplots(figsize=(4, 3))
ax.set_xlabel(r'Pd concentration')
ax.set_ylabel(r'Mixing energy (meV/atom)')
ax.set_xlim([0, 1])
ax.set_ylim([-69, 15])
ax.scatter(data['concentration'], 1e3 * array(data['mixing_energy']),
           marker='x')
ax.plot(hull.concentrations, 1e3 * hull.energies, '-o', color='green')
plt.savefig('mixing_energy_predicted.png', bbox_inches='tight')

# step 4: Extract candidate ground state structures
tol = 0.0005
low_energy_structures = hull.extract_low_energy_structures(
    data['concentration'], data['mixing_energy'], tol)
print('Found {} structures within {} meV/atom of the convex hull'.
      format(len(low_energy_structures), 1e3 * tol))