Analyzing ECIs
It is also of interest to consider the variation of the effective cluster interactions (ECIs) with distance and order. To this end, after loading the cluster expansion constructed previously from file, we first organize information concerning the cluster expansion, including the ECIs, into a dictionary.
ce = ClusterExpansion.read('mixing_energy.ce')
df_ecis = ce.to_dataframe()
Subsequently, the ECIs can be conveniently plotted.
fig, axs = plt.subplots(1, 3, sharey=True, figsize=(7.5, 3))
for k, order in enumerate(ce.orders):
    df_order = df_ecis.loc[df_ecis['order'] == order]
    if k < 2 or k > 4:
        continue
    ax = axs[k - 2]
    ax.set_ylim((-1, 8))
    ax.set_xlabel(r'Cluster radius (Å)')
    if order == 2:
        ax.set_xlim((1.2, 4.2))
        ax.set_ylabel(r'Effective cluster interaction (meV)')
    if order == 3:
        ax.set_xlim((1.5, 3.9))
    if order == 4:
        ax.set_xlim((1.5, 3.9))
        ax.text(0.05, 0.55, 'zerolet: {:.1f} meV'
                .format(1e3 * df_ecis.eci.iloc[0]),
                transform=ax.transAxes)
        ax.text(0.05, 0.45, 'singlet: {:.1f} meV'
                .format(1e3 * df_ecis.eci.iloc[1]),
                transform=ax.transAxes)
    ax.plot([0, 5], [0, 0], color='black')
    ax.bar(df_order.radius, 1e3 * df_order.eci, width=0.05)
    ax.scatter(df_order.radius, len(df_order) * [-0.7],
               marker='o', s=2.0)
    ax.text(0.05, 0.91, 'order: {}'.format(order),
            transform=ax.transAxes)
    ax.text(0.05, 0.81, '#parameters: {}'.format(len(df_order)),
            transform=ax.transAxes,)
    ax.text(0.05, 0.71, '#non-zero params: {}'
            .format(np.count_nonzero(df_order.eci)),
            transform=ax.transAxes,)
plt.savefig('ecis.png', bbox_inches='tight')
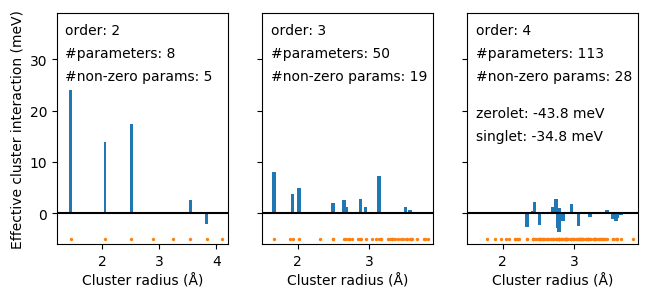
Effective cluster interactions for second (pairs) and third (triplet) order clusters as a function of cluster radius.
Source code
The complete source code is available in
examples/tutorial/4_analyze_ecis.py
# -*- coding: utf-8 -*-
# This scripts runs in about 2 seconds on an i7-6700K CPU.

import matplotlib.pyplot as plt
from icet import ClusterExpansion
import numpy as np

# step 1: Collect ECIs in dictionary
ce = ClusterExpansion.read('mixing_energy.ce')
df_ecis = ce.to_dataframe()

# step 2: Plot ECIs
fig, axs = plt.subplots(1, 3, sharey=True, figsize=(7.5, 3))
for k, order in enumerate(ce.orders):
    df_order = df_ecis.loc[df_ecis['order'] == order]
    if k < 2 or k > 4:
        continue
    ax = axs[k - 2]
    ax.set_ylim((-1, 8))
    ax.set_xlabel(r'Cluster radius (Å)')
    if order == 2:
        ax.set_xlim((1.2, 4.2))
        ax.set_ylabel(r'Effective cluster interaction (meV)')
    if order == 3:
        ax.set_xlim((1.5, 3.9))
    if order == 4:
        ax.set_xlim((1.5, 3.9))
        ax.text(0.05, 0.55, 'zerolet: {:.1f} meV'
                .format(1e3 * df_ecis.eci.iloc[0]),
                transform=ax.transAxes)
        ax.text(0.05, 0.45, 'singlet: {:.1f} meV'
                .format(1e3 * df_ecis.eci.iloc[1]),
                transform=ax.transAxes)
    ax.plot([0, 5], [0, 0], color='black')
    ax.bar(df_order.radius, 1e3 * df_order.eci, width=0.05)
    ax.scatter(df_order.radius, len(df_order) * [-0.7],
               marker='o', s=2.0)
    ax.text(0.05, 0.91, 'order: {}'.format(order),
            transform=ax.transAxes)
    ax.text(0.05, 0.81, '#parameters: {}'.format(len(df_order)),
            transform=ax.transAxes,)
    ax.text(0.05, 0.71, '#non-zero params: {}'
            .format(np.count_nonzero(df_order.eci)),
            transform=ax.transAxes,)
plt.savefig('ecis.png', bbox_inches='tight')